Liverpool grew fast during the 19th century, with docks cut into glacial till and river terraces along the Mersey. Much of the city centre sits on layered sands and clays from the last ice age, overlain by made ground from centuries of port activity. When we run an HVSR microtremor survey in Liverpool, we are mapping the fundamental frequency of that whole package — from the fill down to the bedrock. That single number tells us if a site will amplify or dampen seismic waves. It is a fast, non-invasive way to screen dozens of points before deciding where to drill. We pair it with a MASW survey to get shear-wave velocity profiles, or with test pits where shallow obstructions are suspected.
A single HVSR microtremor survey station in Liverpool costs about £1,100 to £2,170 depending on access and number of points.
Process overview
Eurocode 7 (EN 1997-1:2004) and BS 5930:2015 both require the ground model to include dynamic properties when the structure is sensitive to vibration. In Liverpool that means more than standard boreholes. The HVSR microtremor survey follows the SESAME guidelines (2004) for recording duration and window selection. We deploy a three-component tromometer on the surface and record ambient noise for at least 16 minutes per station. The data are processed to calculate the H/V spectral ratio. Parameters we extract:
Peak frequency (f₀) — usually between 0.8 and 6 Hz in Liverpool
Amplitude at peak — values above 4 indicate a strong impedance contrast
Directionality — useful where geology is anisotropic
For sites near the docks or on reclaimed land we also run a CPT to correlate the frequency with soil stiffness directly.
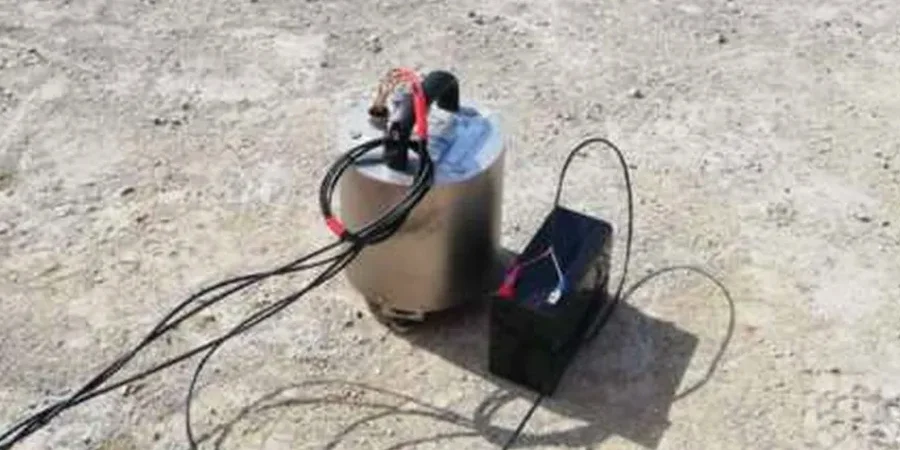
Technical reference image — Liverpool
Local context
The most common mistake we see on Liverpool projects is running only one or two HVSR microtremor survey points and assuming the result applies to the whole site. The geology here changes fast — a filled dock basin next to solid till can have a frequency shift of 3 Hz in 20 metres. If the design team uses a single f₀ for the entire foundation, the structural response calculation will be wrong. We always recommend a grid of at least six stations, spaced 30 to 50 metres apart, to capture the lateral variability. That way the engineer can zone the site into uniform response areas and design accordingly.
Ideal for small residential sites or preliminary screening. We deploy one tromometer, record for 20 minutes, and deliver a clear H/V curve with peak frequency and amplitude. Suitable for building extensions or low-rise housing where the design team needs a quick check on site class.
02
Multi-station HVSR survey (grid)
Recommended for larger developments, schools, or infrastructure. We install 6 to 30 stations on a regular grid. The output includes a contour map of fundamental frequency and a site response zonation. This package is the standard for projects that will later require a full seismic response analysis.
Relevant standards
SESAME Guidelines (2004) — Site Effects Assessment Using Ambient Excitations, Eurocode 7 (EN 1997-1:2004) — Geotechnical design, BS 5930:2015 — Code of practice for ground investigations
Common questions
How much does an HVSR microtremor survey in Liverpool cost?
A single-station survey typically ranges from £1,100 to £2,170, depending on site access, number of points, and reporting detail. Multi-station grids are priced per point and often include a discount for higher volumes. Contact us for a fixed quote based on your layout.
What is the difference between HVSR and MASW for Liverpool sites?
HVSR measures the natural frequency of the soil column using ambient noise only — no active source needed. It is fast and ideal for identifying resonant frequencies. MASW gives a shear-wave velocity profile with depth. For Liverpool's layered glacial deposits we often combine both: HVSR to map lateral variability and MASW to assign stiffness values to each layer.
Can HVSR detect filled ground or buried structures in Liverpool?
Indirectly, yes. A significant contrast in impedance — such as loose fill over dense till — will produce a clear H/V peak at a specific frequency. If the fill is shallow, the peak shifts to higher frequencies. We have mapped old dock basins and railway cuttings in Liverpool using this method. For precise depth to fill, we recommend correlating the HVSR result with a borehole or CPT.