When the drilling rig pulls up on site in Liverpool, the first thing we check is the depth to the Triassic sandstone. Below the city's glacial till and alluvial deposits, that bedrock controls how seismic waves travel. We deploy a portable seismic source and a 24-channel geophone array to record surface wave dispersion. The data is processed in the field using a multichannel analysis of surface waves (MASW) approach, which gives us a one-dimensional shear wave velocity profile down to about 30 metres. That profile feeds directly into the site response analysis, which then tells the structural engineer what acceleration levels to expect at the surface. Before we start any recording, we also run a H/V spectral ratio measurement to identify the fundamental resonance frequency of the soil column. That quick check often reveals whether the site is likely to amplify long-period or short-period motions, and it helps us decide where to place the array.
The Triassic sandstone beneath Liverpool acts as a seismic bedrock, but the overlying glacial and alluvial deposits can amplify ground motions by a factor of two or more.
Process overview
Comparing a site in the Baltic Triangle with one in the northern suburbs near Fazakerley shows how much Liverpool's geology varies. Down by the docks, the fill can be several metres deep, overlying soft alluvial clay and then glacial sand. Up north, you hit glacial till much shallower, and the sandstone comes in at 15 to 20 metres. That contrast means the site response analysis for a new apartment block near the waterfront will show stronger amplification at longer periods than a similar building on the till. We always calibrate our numerical models using local borehole data from the British Geological Survey. For sites where the soil is highly variable, we combine the MASW results with a downhole seismic test to obtain direct P-wave and S-wave travel times. That dual approach reduces uncertainty in the strain-dependent modulus reduction curves we use in the equivalent-linear analysis.
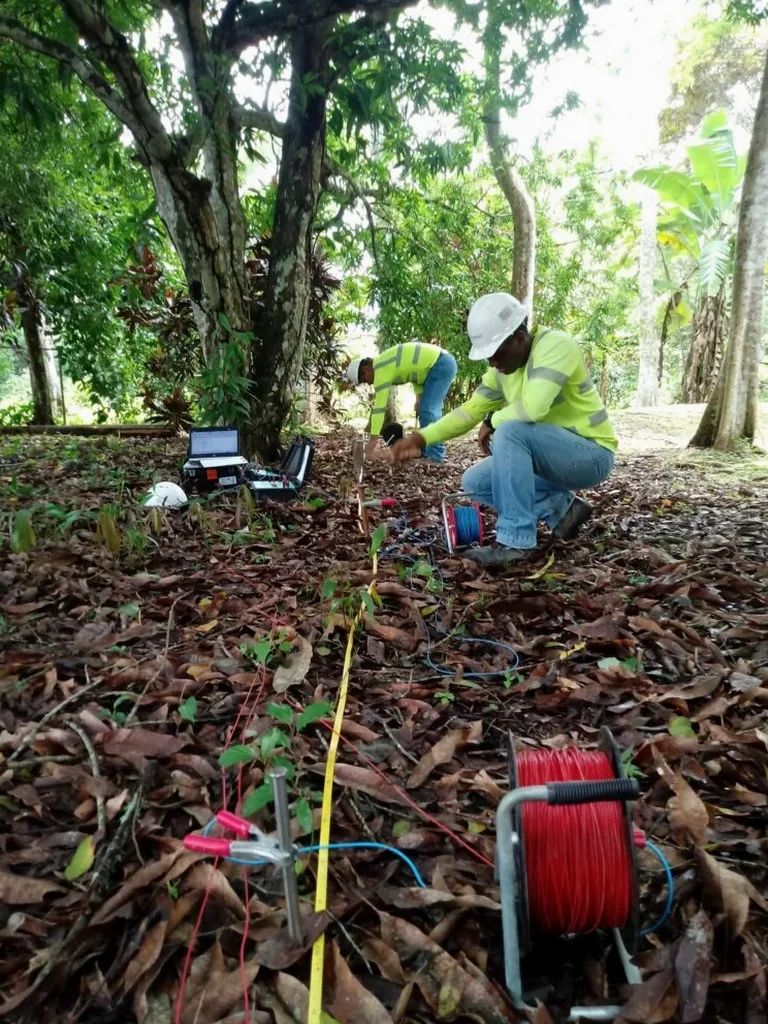
Technical reference image — Liverpool
Local context
Liverpool sits within UK seismic zone 1, where the peak ground acceleration on rock is around 0.05 g to 0.08 g for a 475-year return period. That might sound low, but the soft alluvial soils along the Mersey can amplify those motions significantly. In areas like Toxteth and the Dingle, where made ground and soft clay extend 10 metres or more, we have measured spectral amplification factors above 2.5 at periods between 0.5 and 1.0 seconds. That is exactly the period range that affects medium-rise buildings of 5 to 12 storeys, which are common across the city. Ignoring that amplification in the site response analysis can lead to under-designed lateral systems, particularly for structures built before the current Eurocode 8 provisions were adopted. We always flag this risk early in the design process, especially when the client is working on a brownfield site with variable fill.
Deploy a 24-channel land streamer with active source (sledgehammer or accelerated weight drop) to measure Rayleigh wave dispersion. Inversion yields VS30 profile and site class per Eurocode 8. Typical turnaround: 5 working days for a single array.
02
HVSR (Horizontal-to-Vertical Spectral Ratio)
Record ambient vibrations for 30–60 minutes at each station using a three-component seismometer. We identify the fundamental resonance frequency and amplitude of the soil column, helping to validate the MASW model and to map variability across large sites.
03
Downhole Seismic Testing (P-S Logging)
Measure compressional (P) and shear (S) wave velocities directly in a borehole using a triaxial geophone clamped at 1 m intervals. The source is a horizontal sledgehammer blow on an anvil at surface. This method provides the highest resolution velocity profile for sites with complex layering.
Relevant standards
Eurocode 8 — Part 1 (EN 1998-1:2004) — General seismic actions, Eurocode 7 — Part 2 (EN 1997-2:2007) — Ground investigation and testing, BS 5930:2015 — Code of practice for ground investigations, NEHRP Recommended Seismic Provisions (FEMA P-1050) — Site class definitions
Common questions
What is the difference between site response analysis and a standard seismic hazard assessment?
A seismic hazard assessment gives you the ground motion at bedrock level for a given return period. Site response analysis takes that bedrock motion and propagates it up through the actual soil column above the site in Liverpool. It accounts for soil stiffness, damping, and resonance effects, so the engineer gets the design spectrum at the ground surface — not just at the rock head.
How does Liverpool's glacial till affect the site response compared to a rock site?
Glacial till is generally stiffer than alluvial clay, so it amplifies motions less. In Liverpool, where the till is dense and often overconsolidated, the amplification factor might be 1.3 to 1.8. But if that till is underlain by softer alluvial deposits or thick fill, the overall response can still produce significant spectral peaks. We always run a sensitivity analysis to check how variations in till thickness affect the computed surface motion.
What is the typical cost range for a site response analysis in Liverpool?
For a standard project involving MASW and HVSR on a single site, the cost typically falls between £990 and £3,140. This range covers field mobilisation, data processing, and a detailed report with design acceleration spectra. Larger sites or those requiring downhole testing will be at the higher end.